SLIP Analyzer for Saleae Logic 2

Table of Contents
I’ve been working on a fairly complicated platform over the last year that contains (among many things) a microcontroller (MCU) and a System-on-Chip (SoC), with various services running on these systems that need to communicate with one another. SLIP (Serial Line Internet Protocol) over UART was chosen as one of the communication channels due to its simplicity and lightweight nature. On the application side, all we see is a network interface, so we can simply write UDP or TCP clients and servers, and the rest is handled by the network stacks and UART drivers.
Sometimes, however, we run into issues and need to debug the communication between services. This can sometimes mean digging all the way down to the bits traveling over the wire between the two systems, and we all know how painful that can be.
Hooking up a logic analyzer to view the digital signals is useful, but I wanted the software to not only show me the signals but also decode the data being transmitted (i.e. IP:Port and payload info that tells me which services are communicating), which in this case means decoding UDP/TCP over IP over SLIP over UART.
With a Saleae logic analyzer1 (I’m using the Logic 8), the Logic 2 software, and a custom extension for decoding SLIP frames, I was able to capture, visualize, and analyze the data with relative ease.

What is SLIP?⏚
SLIP (Serial Line Internet Protocol), defined in RFC 10552, is a simple protocol for framing IP packets for point-to-point connections over a serial interface.
The protocol is elegantly simple:
- END character (0xC0): Marks the beginning and end of packets
- ESC character (0xDB): Escapes special bytes in the payload
- ESC_END (0xDC): Represents a literal 0xC0 in the data (sent as 0xDB 0xDC)
- ESC_ESC (0xDD): Represents a literal 0xDB in the data (sent as 0xDB 0xDD)
For example, if you want to send the byte sequence [0x01, 0xC0, 0x02], SLIP would encode it as:
0xC0 0x01 0xDB 0xDC 0x02 0xC0
The 0xC0 at the beginning marks the packet start, the 0xDB 0xDC sequence represents the literal 0xC0 byte in the data, and the final 0xC0 marks the packet end.
While SLIP has largely been replaced by PPP (Point-to-Point Protocol)3 in many applications, it’s still remarkably useful due to its simplicity and minimal overhead.
Why Build a Custom Analyzer?⏚
Saleae Logic 2 comes with many built-in protocol analyzers, but SLIP isn’t one of them.
If all I wanted to do here was parse SLIP frames (i.e. start/end of frame + escaped characters), it would be a trivial extension to write and I’d argue that there is little-to-no value in doing so given you could probably just inspect the packets directly using the existing Async Serial extension4.
However, in my case I want to get information about the TCP/IP or UDP/IP packets encapsulated in the SLIP frames (IP addresses, protocol, port number, etc.), and writing a High-Level Analyzer5 in Python that extends the Async Serial extension is an easy way to achieve this.
Another option would have been to write a custom analyzer in C++ using Saleae’s Protocol Analyzer SDK 6, but then we would have had to write the UART decoding as well and we already get that for free with the existing Async Serial analyzer.
With a custom High-Level Analyzer (HLA), I can:
- Decode SLIP frames: Process framing and escape sequences
- Parse IPv4 headers: Extract source/destination IPs, protocol types, and other header fields
- Identify TCP/UDP ports: See which services are communicating
- Catch protocol errors: Detect invalid escape sequences or malformed packets
The alternative would have been copying hex dumps, writing scripts to parse them offline, and constantly switching between tools. With a custom HLA, all this information appears directly in the Logic 2 interface.
How High-Level Analyzers Work⏚
Saleae’s High-Level Analyzer (HLA) framework allows you to write Python-based protocol decoders that process data from lower-level analyzers. In my case, the HLA relies on receiving frames from the Async Serial analyzer as the input, and will output decoded SLIP + IP + UDP/TCP decoded frames.
The workflow is:
- Configure Async Serial analyzer to decode the UART traffic
- Attach the SLIP HLA to the Async Serial analyzer output
- The HLA processes each byte, building up SLIP frames and parsing their contents
- Display decoded frames with human-readable information in the Logic 2 timeline, data table, and terminal UI
The HLA API is straightforward, and all you really need to implement is a class that extends HighLevelAnalyzer and define a decode() method that receives frames from the input analyzer and yields new frames with your decoded data. Saleae handles all the UI integration, timeline rendering, and data management.
Building the SLIP Decoder⏚
- GitHub Repo: saleae-analyzers/slip
Architecture⏚
The code for the analyzer is pretty simple:
- SLIP Frame Decoder: Handles the low-level SLIP protocol (escape sequences, framing)
- IPv4 Parser: Extracts and parses IPv4 headers from SLIP payloads
- Result Formatter: Combines SLIP and IP information into displayable frames
At a high level, it looks something like this:
  ---
config:
  class:
    hideEmptyMembersBox: true
---
classDiagram
    class saleae.analyzers.HighLevelAnalyzer {
        <<interface>>
        + decode(frame) AnalyzerFrame[]
    }

    class SLIP_HLA {
        + decode(frame) AnalyzerFrame[]
        - _emit_ipv4_frame(start_time, end_time) AnalyzerFrame
        - _emit_packet_frame(end_time) AnalyzerFrame
        - _emit_error_frame(end_time, message, offending_byte) AnalyzerFrame
    }

    class AnalyzerFrame {
        + str type
        + saleae.data.GraphTime start_time
        + saleae.data.GraphTime end_time
        + dict data
    }

    class SlipProtocol {
        <<enumeration>>
        END = 0xC0
        ESC = 0xDB
        ESC_END = 0xDC
        ESC_ESC = 0xDD
    }

    class ProtocolNames {
        <<enumeration>>
        ICMP = 1
        TCP = 6
        UDP = 17
    }

    saleae.analyzers.HighLevelAnalyzer <|-- SLIP_HLA : implements
    SLIP_HLA ..> AnalyzerFrame : creates
    SLIP_HLA ..> SlipProtocol : uses
    SLIP_HLA ..> ProtocolNames : uses
Logic 2 feeds Async Serial frames to the SLIP HLA via the HighLevelAnalyzer::decode() interface, which implements the state machine looking for start/end SLIP frames. When a SLIP frame is found, it is then parsed in one of the following ways:
- If there is a problem decoding the SLIP frame, issue an error frame.
- Otherwise, attempt to parse the frame as an IPv4 packet (I’m not worrying about IPv6 here).
- If it fails to parse the data as an IPv4 packet, simply display the data in the SLIP frame without parsing.
SLIP Decoding State Machine⏚
The state machine in decode() is pretty simple for the SLIP protocol:
- IDLE state: Wait for
0xC0(END) to start a new packet - IN_PACKET state: Accumulate payload bytes
- If we see
0xC0, the packet is complete - If we see
0xDB(ESC), transition to ESCAPE state
- If we see
- ESCAPE state: Process the next byte
0xDC→ Insert literal0xC0into payload0xDD→ Insert literal0xDBinto payload- Anything else → Protocol error

Once a complete packet is received, it’s passed to the IPv4 parser.
IPv4 Header Parsing⏚
After decoding the SLIP frame, the analyzer checks if the payload looks like an IPv4 packet (version field = 4). If so, it extracts:
- Version and Header Length
- Total Length
- Protocol (TCP, UDP, ICMP, etc.)
- Source and Destination IP Addresses
- TCP/UDP Port Numbers (if applicable)
Error Handling⏚
The analyzer detects and reports several error conditions:
- Invalid SLIP escape sequences: When 0xDB is followed by something other than 0xDC or 0xDD
- Malformed IPv4 packets: When the payload is too short or has invalid version/length fields
- Incomplete frames: When data ends mid-packet
These errors appear as distinct frame types in Logic 2, making it easy to spot protocol violations.
Displaying Results⏚
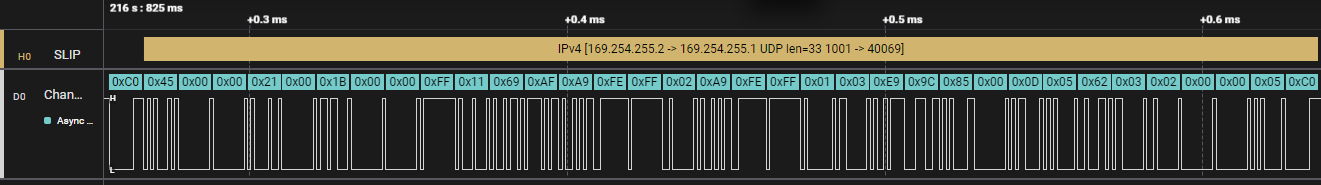
The final piece is formatting the decoded information for display. The HLA creates frames with descriptive strings like:
IPv4 [192.168.1.10 -> 192.168.1.1 UDP len=33 5000 -> 8080]
This appears in the Logic 2 timeline, aligned with the serial data that was decoded. You can click on any frame to see the timing, raw bytes, and decoded information side-by-side.
The parsed IPv4 frame is also shown directly in the Data Table:

Improvements and Future Work⏚
There are several enhancements I’d like to make to this extension:
- Export PCAP: Figure out a way of generating a PCAP directly from the captured SLIP data which I could then analyze directly in Wireshark (although for this I think I need to go the C++ SDK approach rather than Python High-Level Analyzer).
- Protocol Statistics: Add a “Cumulative Stats” field to track packet counts, error rates, and throughput.
- Add option to connect two Async Serial inputs: Give the option to configure two Async Serial input sources (RX and TX) and be able to track conversations between peers (SRC-IP:SRC-Port <–> DST-IP:DST-Port) to be able to measure latencies.
- Bidirectional Analysis: Track request/response pairs and calculate latencies.
- Configuration Options: Allow users to enable/disable IPv4 parsing or customize display format via input options.